
What IS a Head and Shoulder Pattern?
A head and shoulders pattern is a chart formation that resembles, you guessed it… a head and shoulders, (or in the case of a downtrend), an upside-down head and shoulders pattern (pretty simple, right?)..
It is made of a baseline with three peaks, the outside two are similar size (shoulders) and the middle is highest (head). In technical analysis, a head and shoulders pattern describes a specific chart formation that predicts a bullish-to-bearish trend reversal.
The head and shoulders pattern is believed to be one of the most reliable trend reversal patterns. It is one of several top patterns that signal, with varying degrees of accuracy, that an upward trend is nearing its end.
The opposite is true of an inverse H&S pattern, which indicates that a bearish trend is coming to an end and the bulls are starting to take over. Each pattern, whether it be bullish or bearish would also be accommodated by a rising or declining amount of volume, which helps to give clarification to us traders that indeed this pattern may well start to play out.
When these happen, price rises to a peak and then reverses back to the start of the previous up-move. Then, the price rises above the former peak to form the “nose” and then again declines back to the original base. Then finally, the stock price rises again, but to the level of the first, initial peak of the formation before declining back down to the base or neckline of chart patterns one more time.
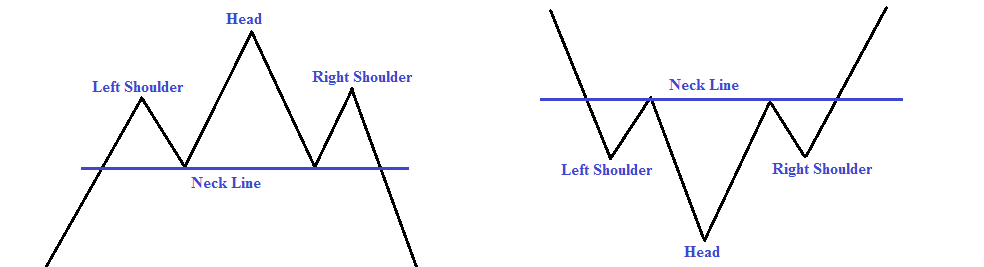
(Left to Right) Head and shoulder TOP / Head and Shoulder Bottom
First Type: Head and Shoulder (Top)
Head and Shoulders formation consists of a left shoulder, a head, and a right shoulder and a line drawn as the neckline. The left shoulder is formed at the end of an extensive move during which volume is noticeably high.
After the peak of the left shoulder is formed, price hits resistance, then begins to move down to a certain point (the formation of the neckline), which will be accommodated by declining volume… The price will then rally up to form the head with normal or heavy volume, which is followed by yet another downward with declining volume back to the neckline. (As seen by the image below)
The right shoulder is formed when prices move up again but remain below the middle peak called the Head, which then falls down nearly equal to the first valley between the left shoulder and the head.. or at least below the peak of the left shoulder. Volume is lesser in the right shoulder formation compared to the left shoulder and the head formation.
A neckline is drawn across the bottoms of the left shoulder, the head, and the right shoulder. When prices break through this neckline and keep on falling after forming the right shoulder, it is a definite confirmation of the completion of the Head and Shoulders Top formation. Prices may also pull back to touch the neckline before continuing their declining trend.

Key Takeaway – This formation MUST occur at the top of an uptrend
Head and Shoulder Bottom (Inverted H&S)
This formation is simply the inverse of a Head and Shoulders Top and often indicates a change in the trend and the sentiment from bearish to bullish (cha-ching!). The major distinction between a head and shoulder top and bottom is that the inverted head and shoulder must occur at the end of a downtrend
This mistake is made far too often by new traders and could cost you big if you identify a normal head and shoulders at the bottom of a downtrend, instead of looking for the IH&S (don’t be that trader!)
The formation is upside down in which volume pattern is different from a Head and Shoulder Top. Prices move up from the first low with increases in volume up to a level to complete the left shoulder formation and then falls down to a new low.
It follows by a recovery move that is marked by somewhat more volume than seen before to complete the head formation. A corrective reaction on low volume occurs to start the formation of the right shoulder and then a sharp move up that must be on quite heavy volume breaks though the neckline.
Another difference between the Head and Shoulders Top and Bottom is that the Top Formations in regulated markets (Such as forex) in comparison to crypto is that in regulted markets, these formations are completed in a few weeks, whereas a Major Bottom (Left, right shoulder or the head) usually takes a longer, and as observed, may prolong for a period of several months or sometimes more than a year.
In crypto, these can occur far more quickly, in a matter of hours or days when playing on the smaller time frames, however they can take much longer to play out (similar to regulated markets) when playing on the 1D or higher timeframes.

Don’t Forget the Neckline!
The drawn neckline of the pattern represents a level of support and you could consider it as the last line of defence for buyers and sellers and is an important level of interest to see whether price will break the neckline, indicating a time to sell (our of) or buy (into) positions.
The neckline forms by connecting reaction highs 1 and 2. Reaction High 1 marks the end of the left shoulder and the beginning of the head. Reaction High 2 marks the end of the head and the beginning of the right shoulder.
Depending on the relationship between the two reaction highs, the neckline can slope up, slope down, or be horizontal. The slope of the neckline will affect the pattern’s degree of bullishness: an upward slope is more bullish than a downward slope.

Characteristics of a Head and Shoulder Pattern…
- Most of the time Head and Shoulders are not perfectly shaped. This formation is slightly
tilted upward or downward. - One shoulder may appear to droop.
- On many chart patterns, any one of the two shoulders may appear broader than the
other which is caused by the time involved in the formation of the valleys. - The neckline may not be perfectly horizontal; it may be ascending or descending.
- If the neckline is ascending then the only qualification of the formation lies in the fact
that the lowest point of the right shoulder must be noticeably lower than the peak of
the left shoulder.
Volume – An Important Consideration
While volume plays an important role in the Head and Shoulders Top, it plays a crucial role in the Head and Shoulders Bottom. Without the proper expansion of volume, the validity of any breakout becomes suspect. Volume can be measured as an indicator or simply by analyzing the absolute levels associated with each peak and trough.
Volume levels during the first half of the pattern are less important than in the second half. Volume on the decline of the left shoulder is usually pretty heavy and selling pressure quite intense.
The intensity of selling can even continue during the decline that forms the low of the head. After this low, subsequent volume patterns should be watched carefully to look for expansion during the advances.
Volume analysis helps distinguish between normal profit-taking and heavy selling pressure. The most important moment for volume occurs on the advance from the low of the right shoulder. For a breakout to be considered valid, there needs to be an expansion of volume on the advance and during the breakout.
Head and Shoulders Terminology
- Prior Trend: It is important to establish the existence of a prior downtrend for this to be a reversal pattern. Without a prior downtrend to reverse, there cannot be a Head and Shoulders Bottom formation.
- Left Shoulder: While in a downtrend, the left shoulder forms a trough that marks a new reaction low in the current trend. After forming this trough, a move follows to complete the formation of the left shoulder. The high of the decline usually remains below any longer trend line, keeping the downtrend intact.
- Right Shoulder: The decline from the high of the head (neckline) begins to form the right shoulder. This low is always higher than the head, and it is usually in line with the low of the left shoulder. While symmetry is preferred, sometimes the shoulders can be out of whack, and the right shoulder will be higher, lower, wider, or narrower. When the advance from the low of the right shoulder breaks the neckline, the Head and Shoulders Bottom reversal is complete.
- Head: From the high of the left shoulder, a decline begins that exceeds the previous low and forms the low point of the head. After making a bottom, the high of the subsequent advance forms the second point of the neckline. The high of the advance sometimes breaks a downtrend line, which calls into question the robustness of the downtrend.
- Neckline Break: The Head and Shoulders Bottom pattern is not complete, and the
downtrend is not reversed until neckline resistance is broken. For a Head and Shoulders
Bottom, this must occur in a convincing manner, with an expansion of volume.
- Resistance Turned Support: Once resistance is broken, it is common for this same
resistance level to turn into support. Often, the price will return to the resistance break,
and offer a second chance to buy.
Join The Community For Serious Crypto Traders
Our incredibly supportive community of like-minded traders are all waiting for YOU. Come and Join us today, helping you to take your trading knowledge from where you are now, to where you want to be.
Join The Community For Serious Crypto Traders
Our incredibly supportive community of like-minded traders are all waiting for YOU. Come and Join us today, helping you to take your trading knowledge from where you are now, to where you want to be.
* 2018 Unity Trading Group PTY LTD. The information on this website has been created by Unity Trading Group (ABN: 630163343) for general information and educational purposes only and is not to be constructed as personal or financial advice. All forms of trading carry a high level of risk, and may not be suitable for all investors. Before deciding to trade any market reported on by Unity Trading Group you should carefully consider your objectives, financial situation, needs, and level of experience. By trading, you could sustain a loss in excess of your deposited funds. Before trading ASX/FX/Cryptocurrency markets you should be aware of all the risks associated with trading. Unity Trading Group recommends you seek advice from a separate financial advisor before making any decisions based on the general information given on this website or affiliated platforms.